
Entertainment & ecommerce / CLIENT CASE STUDY
Epic King Comics: 31.48% more organic-search sessions
Organic-search sessions increased from 1,099 to 1,445, while engaged organic sessions rose from 778 to 1,013. A closer look at search visibility for a specialist comic-book retailer—and the next measurement opportunity.
See the original reportsTHE RECORDED RESULTS
Performance at a glance.
1 June–31 August 2026Compared with 1 March–31 May 2026
- Organic-search sessions
- +31.48%
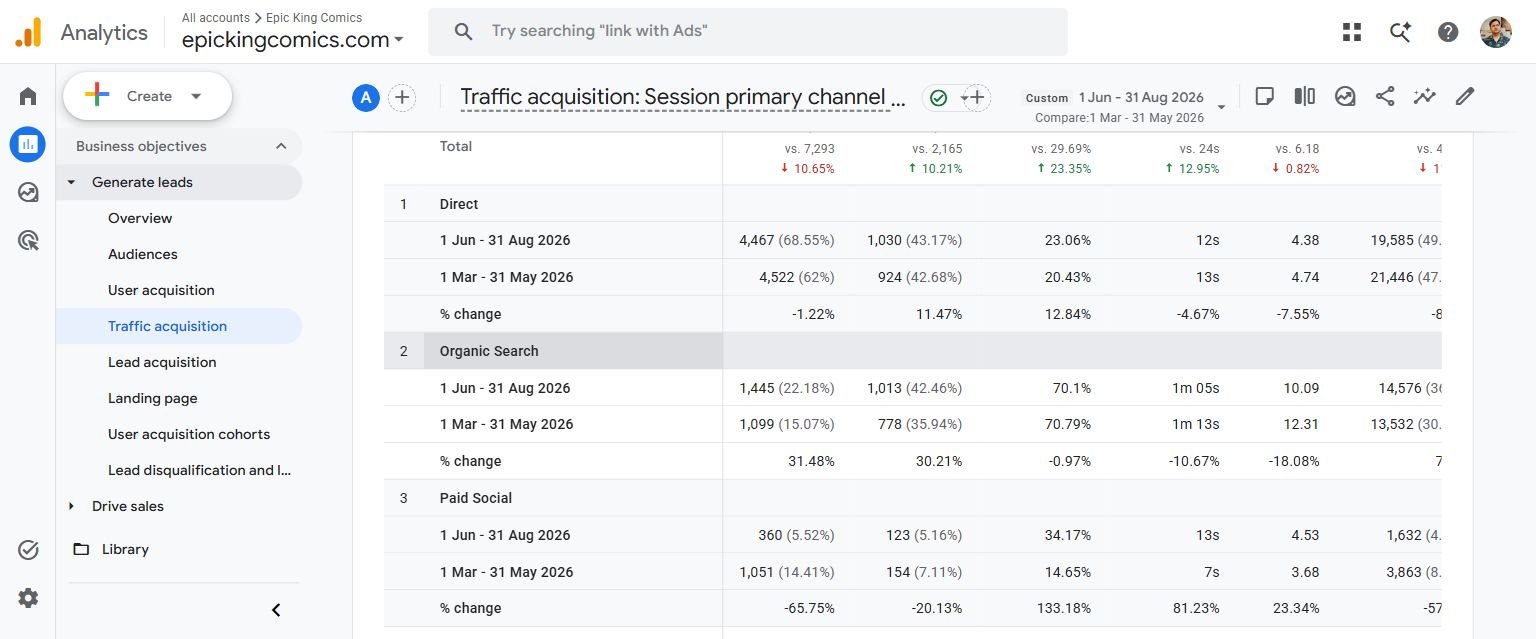
1,445 sessions, compared with 1,099 in the preceding 92 days: 346 additional visits.
- Engaged organic sessions
- +30.21%
1,013 engaged sessions, compared with 778 in March–May.
- Organic engagement rate
- 70.1%
Compared with 70.79% in the previous period; the larger audience retained a similar engagement rate.
A specialist catalogue with a clear search opportunity
Epic King Comics is an online comic-book retailer serving buyers in India. Its public catalogue includes DC, Marvel, Image, Dark Horse, Boom Studios and Dynamite, with dedicated areas for pre-orders and recent arrivals. Individual listings distinguish issues, editions and cover variants. That makes discoverability a practical commercial question: can a reader looking for a particular comic find the relevant product and understand what is available?
For this type of catalogue, organic search can connect detailed product interest with a purchase opportunity. This case examines the recorded search audience first, then asks what further measurement would be needed to understand its commercial value. The evidence is the client’s Google Analytics 4 traffic report, reviewed over two equal periods of 92 days.
346 additional visits from organic search
From 1 June to 31 August 2026, Organic Search generated 1,445 recorded sessions. Between 1 March and 31 May, it generated 1,099. The increase was 346 sessions, or 31.48%. The absolute counts matter: this was a measurable addition to an existing audience of more than a thousand visits in the comparison period.
Organic Search also accounted for a larger part of the recorded traffic mix, increasing from 15.07% to 22.18% of sessions. Total website sessions moved in the opposite direction, falling from 7,293 to 6,516. Looking at the channel separately therefore reveals progress that the overall traffic total would conceal. It also keeps the conclusion precise: this is an improvement in recorded organic traffic.
Engagement grew with the search audience
Engaged organic sessions increased from 778 to 1,013, an addition of 235 and a 30.21% rise. This is a useful companion to the traffic result because it shows that the increase included more sessions meeting GA4’s engagement criteria. The organic engagement rate remained broadly similar at 70.1%, compared with 70.79% previously.
Average engagement time per organic session was 1 minute 5 seconds, compared with 1 minute 13 seconds. The result is therefore a larger engaged audience, with slightly less average engagement time per session. A useful next analysis would separate product pages, publisher categories and pre-order pages to identify where that audience lands and which journeys deserve closer attention. The current acquisition report does not provide that page-level explanation.
Where the commercial evidence stops
The selected report recorded zero key events and zero revenue in both periods. The key-event selector listed purchase, and no saved explorations were available in the property during the review. These observations do not establish that the shop made no sales; they establish that this report cannot connect the traffic increase to recorded purchases or revenue.
The next measurement priority would be to verify the purchase event against completed orders and inspect the steps between product discovery and checkout. Once that connection is dependable, the same organic audience could be evaluated through product views, basket activity and completed orders. Until then, the useful result is increased search reach and engagement, with the commercial outcome left open.
The wider chart adds perspective
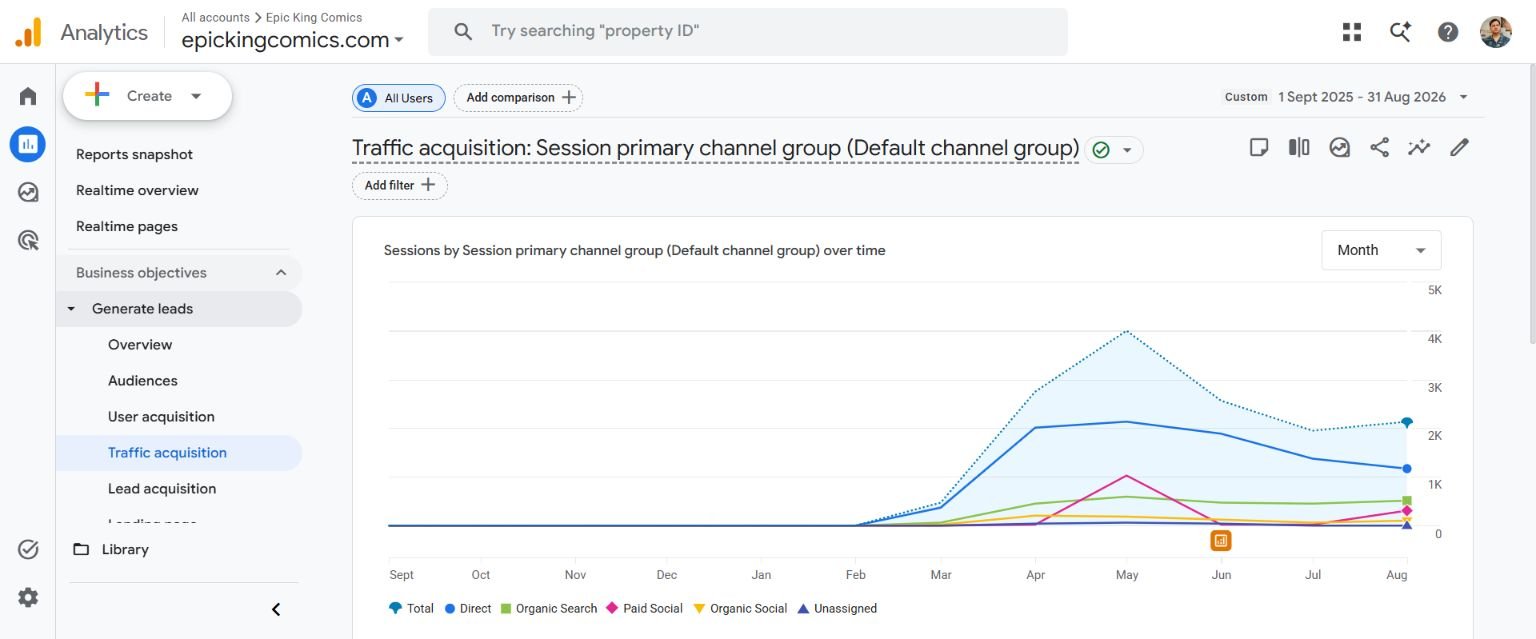
The accompanying annual screenshot covers 1 September 2025 to 31 August 2026. It shows little meaningful recorded traffic before March, followed by an organic rise through May, a softer June–July period and an improvement in August. It is not a smooth upward line across every month.
The all-channel chart also shows a May peak followed by lower totals. In the quarter comparison, Paid Social sessions declined from 1,051 to 360 and Organic Social from 430 to 295. Those changes help explain why total sessions can fall while search sessions grow. They do not identify a campaign decision or prove a cause. Historical tracking coverage and the different channel patterns belong beside the headline result.
What this suggests for the next phase
The immediate opportunity is to understand the 1,013 engaged organic sessions more deeply. A focused next review would connect landing pages with product availability, inspect how readers move between related issues and editions, and check whether pre-order information answers the questions needed before checkout. These are proposed next steps, not a claim that particular changes produced the observed increase.
For a specialist retailer, the useful lesson is to read acquisition and commerce together. Epic King Comics has evidence of a larger search audience whose engagement rate stayed broadly stable. Reliable order measurement would make that finding more actionable by showing which parts of the catalogue attract visits that become purchases. The present case gives a clear starting point for that next decision.
FROM THE CLIENT’S GOOGLE ANALYTICS 4
The original reports.
Open any screenshot to inspect the captured report at full size.
 Open full-size screenshot
  Open full-size screenshot
 HOW TO READ THESE RESULTS
Measurement context.
Analytics source: the epickingcomics.com GA4 property, reviewed on 10 September 2026. Traffic acquisition uses Session primary channel group (Default channel group); the Organic Search row is compared across 1 June–31 August and 1 March–31 May 2026. Both periods contain 92 days.
Sessions are visits, not unique people. Engaged sessions, engagement rate and time per session are the report’s metrics. The report recorded no key events or revenue in either period; no sales, lead or revenue increase is asserted.
The annual chart covers 1 September 2025–31 August 2026 and has a limited recorded baseline before March. Analytics alone does not verify tracking continuity or identify which marketing work caused a change. The proposed next steps are recommendations rather than a record of services delivered.
Screenshots are original GA4 captures copied without altering the chart or values. Business and catalogue context comes from the client’s public website, inspected on 10 September 2026.
Business context: Epic King Comics: catalogue and publisher categories (opens in a new tab)
LET’S LOOK AT YOUR OPPORTUNITY
Where could your next enquiry come from?
Talk with our team about your audience, your website and the results that matter to your business.
Explore another client story.
Legal services · United States
JG Criminal Law
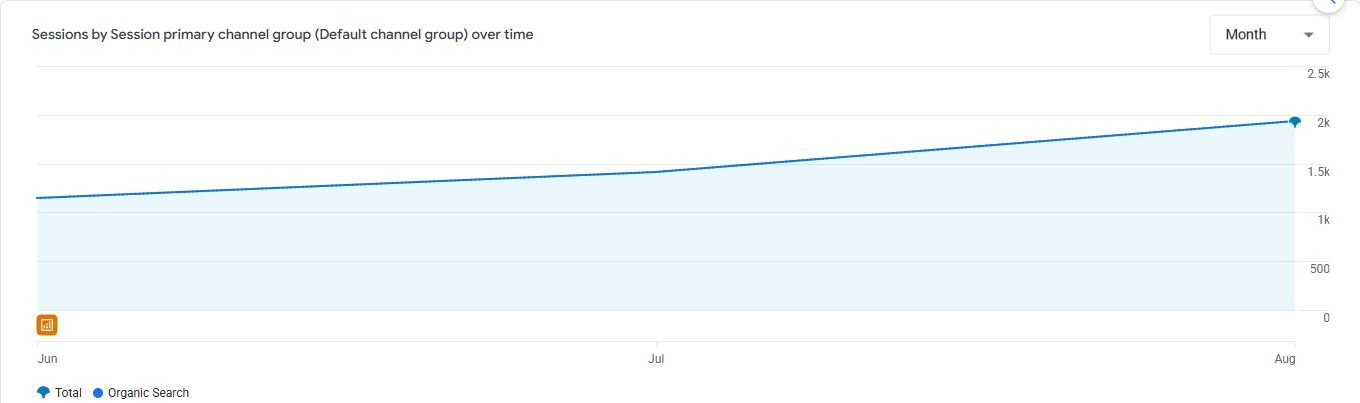
Google Analytics recorded 4,511 organic-search sessions in June–August 2026, compared with 1,172 in the preceding three months. Explore the traffic trend, engagement and original reports.
+284.9%Organic-search sessions
1 June–31 August 2026Compared with 1 March–31 May 2026
Explore the case study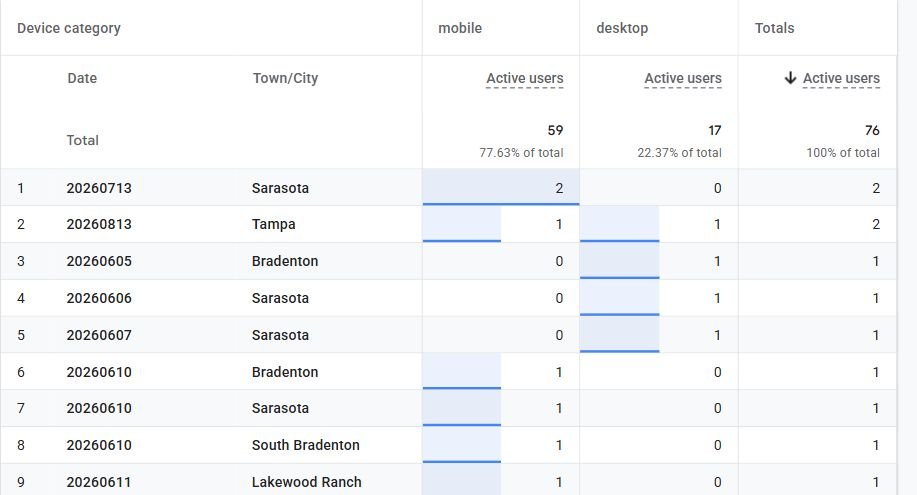
Real estate & home services · United States
Dream Closets
A saved GA4 exploration recorded 76 U.S. users with form-submission activity in June–August 2026. The traffic report also shows a recent recovery in organic-search visits, with the wider context included.
76U.S. users with recorded form submissions
1 June–31 August 2026
Explore the case study