
Real estate & home services / CLIENT CASE STUDY
Dream Closets: form enquiries and organic-search recovery
A saved GA4 exploration recorded 76 U.S. users with form-submission activity in June–August 2026. The traffic report also shows a recent recovery in organic-search visits, with the wider context included.
See the original reportsTHE RECORDED RESULTS
Performance at a glance.
1 June–31 August 2026Traffic comparison: 1 March–31 May 2026
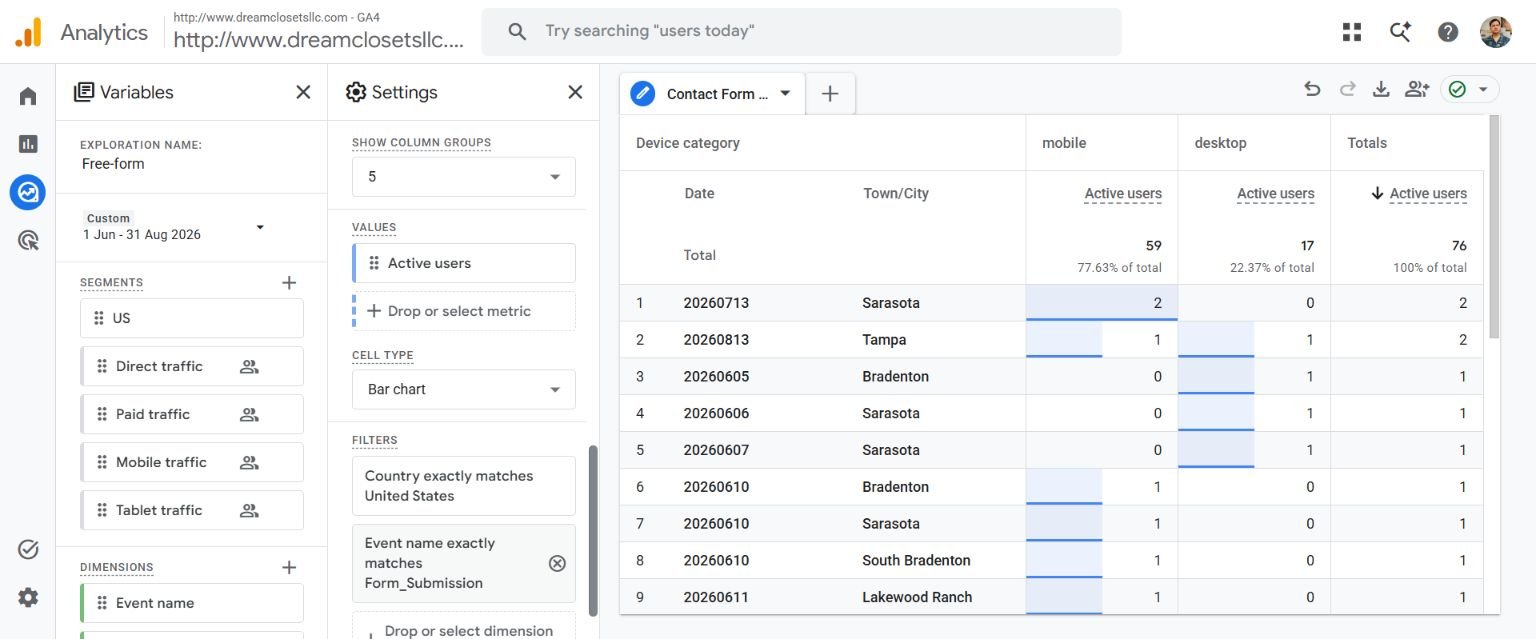
- U.S. users with recorded form submissions
- 76
Active users matching the saved exploration’s United States and Form_Submission filters. All traffic sources.
- Organic-search sessions
- 332
Compared with 62 in March–May: a 435.48% increase from a small base.
- Organic generate_lead events
- 17
Recorded event occurrences in June–August; these are not verified unique or qualified leads.
The business
Dream Closets designs and installs custom closets, built-in cabinetry, garage storage, pantries and other home storage solutions. The business serves homeowners around Sarasota, Bradenton, Lakewood Ranch and Florida’s Gulf Coast.
The form-enquiry exploration
The client’s saved Contact Form Leads exploration recorded 76 active users matching two filters between 1 June and 31 August 2026: Country exactly matches United States, and Event name exactly matches Form_Submission.
The device breakdown was 59 mobile users and 17 desktop users. This is useful evidence of recorded form activity across devices. It does not establish that all submissions were unique, successfully delivered, qualified or converted into customers.
Organic search: a recent recovery
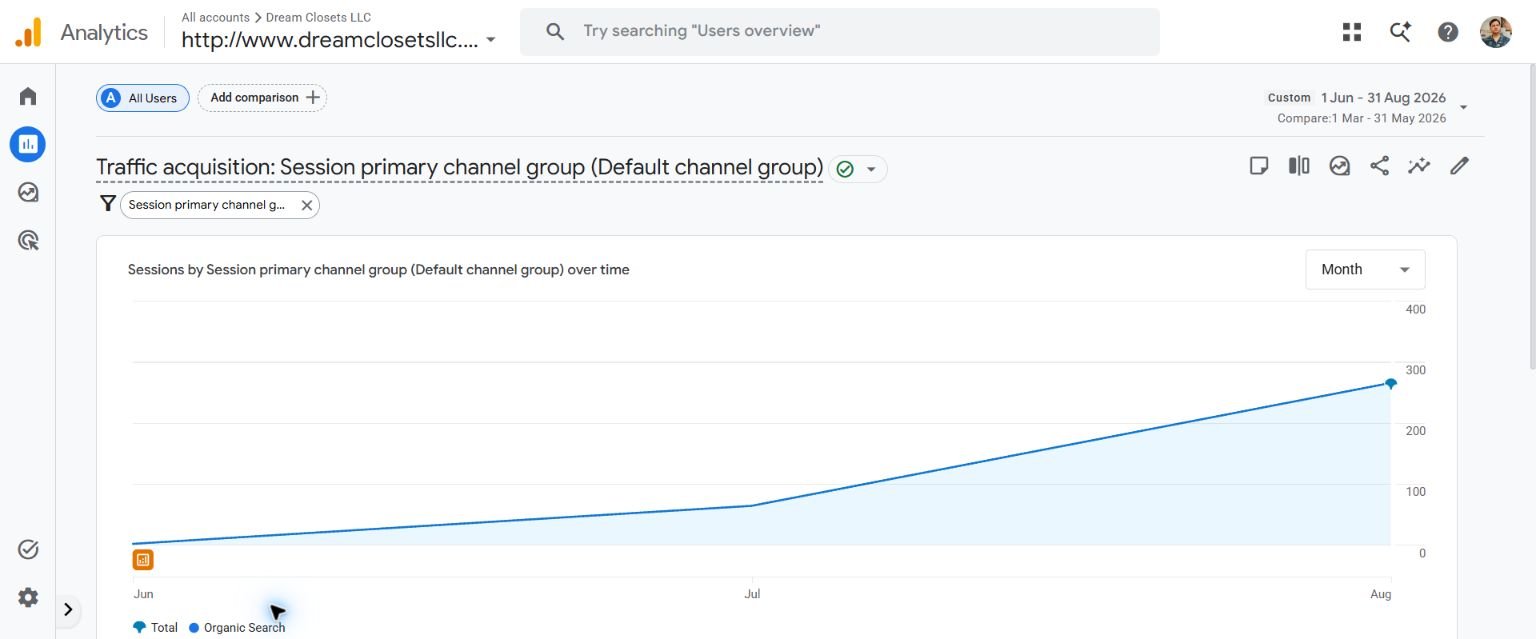
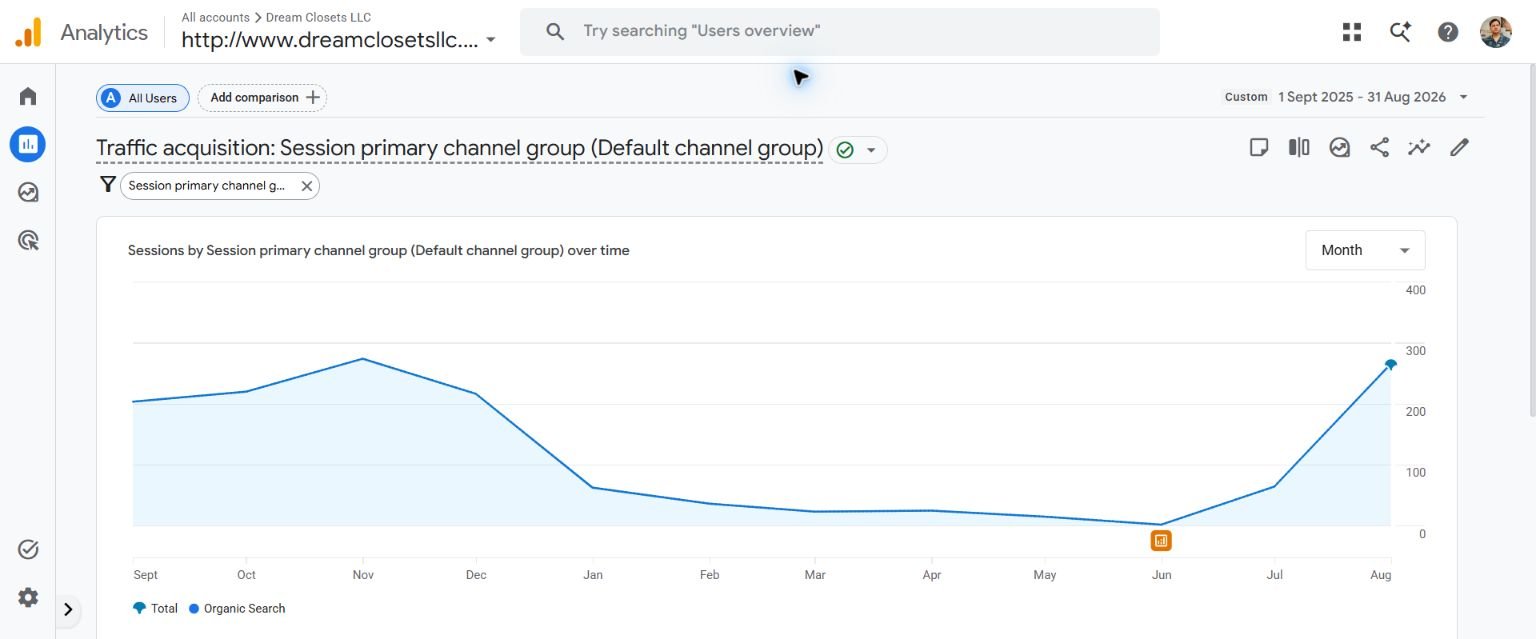
The separate Traffic acquisition report recorded 332 Organic Search sessions in June–August, compared with 62 in March–May—a 435.48% increase from a small starting base. Engaged organic sessions rose from 16 to 190, and engagement rate increased from 25.81% to 57.23%.
The full-year chart shows that this was a recovery after an earlier decline. Total website sessions fell from 3,718 to 2,705 over the same three-month comparison, alongside lower Cross-network traffic. The organic result should therefore be read as a channel-specific improvement.
Keeping enquiry metrics separate
The Organic Search report recorded 17 generate_lead events in June–August. The earlier period recorded zero, but that does not prove that the business previously received no enquiries; tracking definitions and coverage can differ.
The 76 users in the form exploration and the 17 organic lead events use different metrics, event names and traffic scopes. They must not be added together. The case study reports each measure in its original context rather than treating them as one lead total.
FROM THE CLIENT’S GOOGLE ANALYTICS 4
The original reports.
Open any screenshot to inspect the captured report at full size.
 Open full-size screenshot
  Open full-size screenshot
  Open full-size screenshot
 HOW TO READ THESE RESULTS
Measurement context.
Source: the client’s Google Analytics 4 property for dreamclosetsllc.com, inspected on 10 September 2026. The saved exploration used Active users, United States and the case-sensitive event name Form_Submission. Its selected reporting period was 1 June–31 August 2026, and the report indicated 100% of available data.
The traffic comparison uses the Session primary channel group (Default channel group) exactly matching Organic Search. It compares 1 June–31 August with 1 March–31 May 2026, two periods of 92 days. generate_lead figures use Event count filtered to that event.
Event occurrences, active users and qualified enquiries are different measures. Tracking implementation, delivery, deduplication and sales outcomes have not been independently verified, so these figures are not presented as verified new customers or revenue.
These reports describe recorded activity and do not alone prove that any particular marketing action caused the change. The recent organic recovery is shown alongside the wider annual trend and the decline in all-source sessions. The original exploration was restored to its previous date view after capture.
LET’S LOOK AT YOUR OPPORTUNITY
Where could your next enquiry come from?
Talk with our team about your audience, your website and the results that matter to your business.
Explore another client story.
Real estate & home services · United States
No Leak Gutters
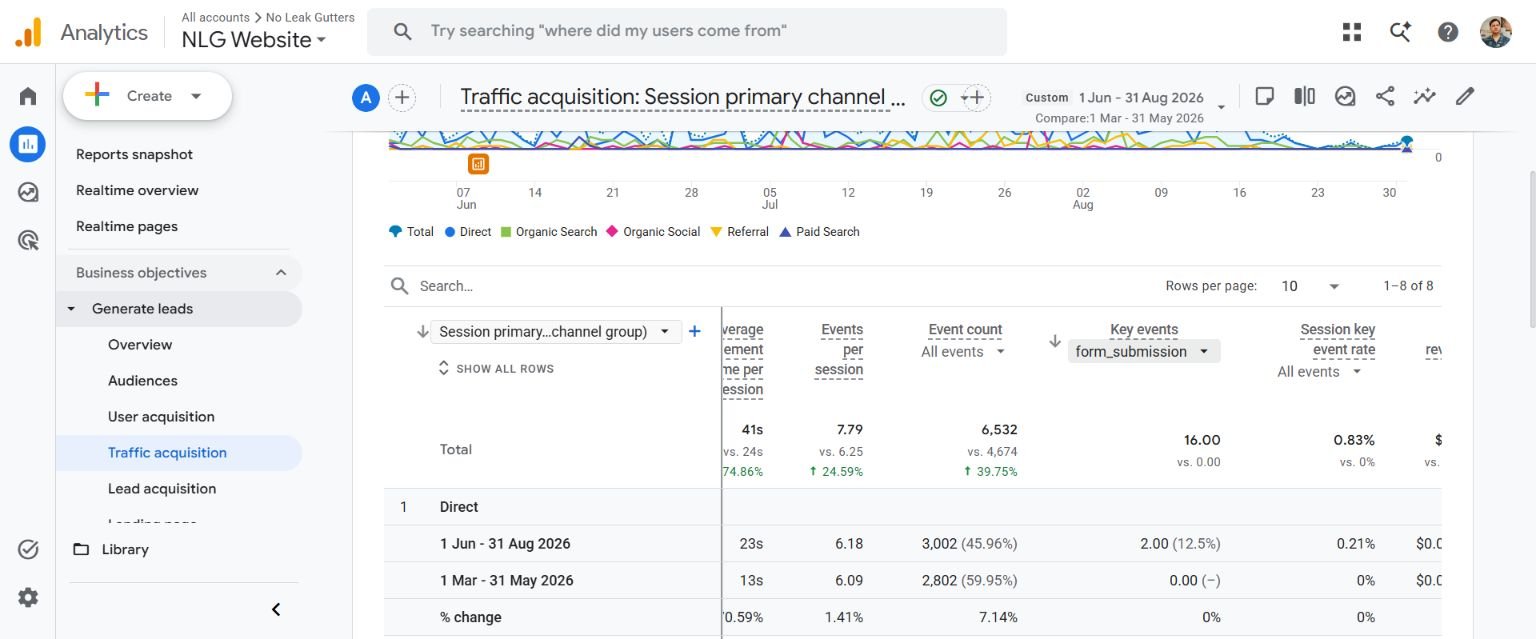
GA4 recorded 16 form-submission key events in June–August 2026, including 10 attributed to Organic Search. Organic visits rose 19.01%, while engaged organic sessions increased 39.51%.
16Recorded form-submission key events
1 June–31 August 2026
Explore the case study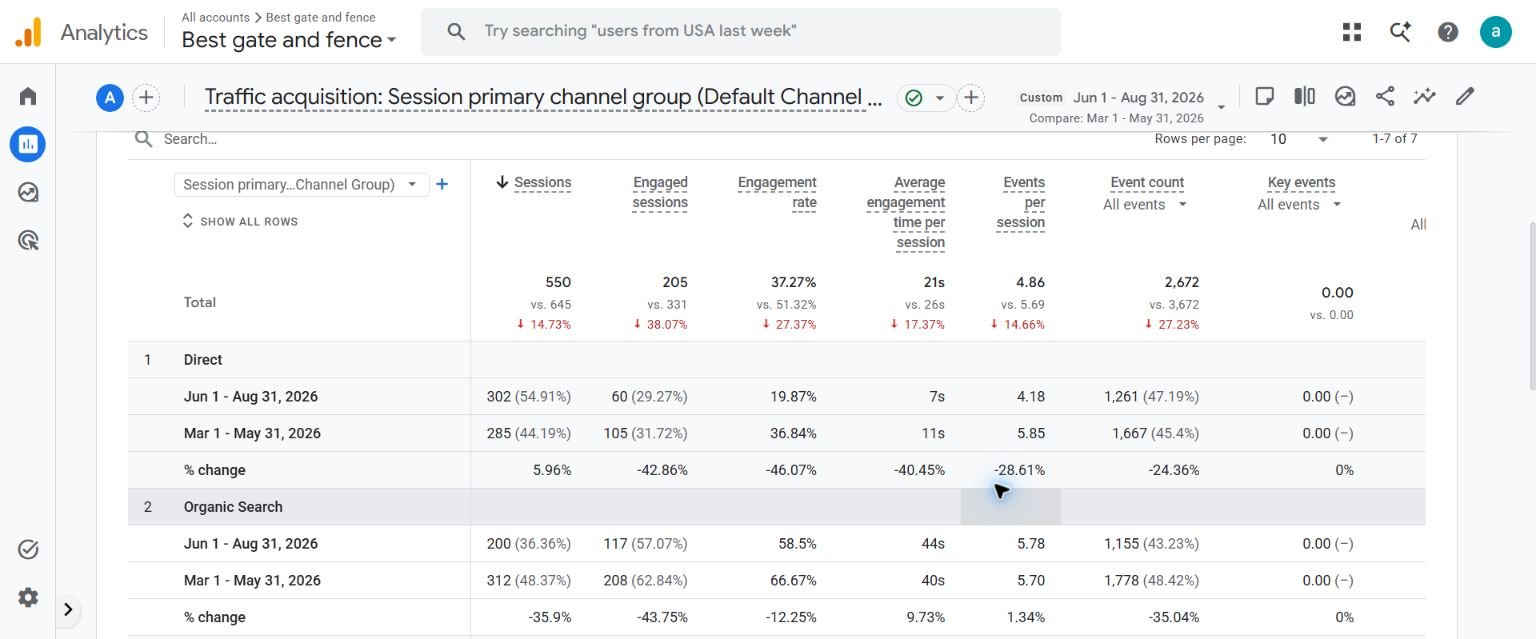
Fencing, gates & outdoor home services · United States
Best Gate & Fence
A review of 200 Organic Search visits and the engagement behind them, with the preceding period shown clearly and no unsupported lead claim.
200Organic Search sessions
1 June–31 August 2026Compared with 1 March–31 May 2026
Explore the case study